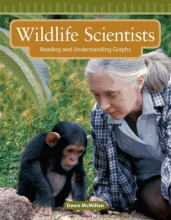
Wildlife scientists :reading and understanding graphs
An introduction to data analysis and probability that describes how wildlife scientists such as Ian Stirling and Jane Goodall use graphs and charts in their work, and includes a time line and problem-solving activity.
Teacher Created Materials
2008
9780743908894
book
Holdings
| hid | mid | miid | nid | wid | location_code | location | barcode | callnum | dewey | created | updated |
|---|---|---|---|---|---|---|---|---|---|---|---|
| 3998952 | 7265860 | 2427 | 370428 | 521544 | VCP | 434 | VCP0226150 | LEVEL LQ MCM | 1000 | 1736800991 | 1736800991 |
| 3998953 | 7265860 | 2427 | 370428 | 521544 | VCP | 434 | VCP0226148 | LEVEL LQ MCM | 1000 | 1736800991 | 1736800991 |
| 3998954 | 7265860 | 2427 | 370428 | 521544 | VCP | 434 | VCP0226146 | LEVEL LQ MCM | 1000 | 1736800991 | 1736800991 |
| 3998955 | 7265860 | 2427 | 370428 | 521544 | VCP | 434 | VCP0226147 | LEVEL LQ MCM | 1000 | 1736800991 | 1736800991 |
| 3998956 | 7265860 | 2427 | 370428 | 521544 | VCP | 434 | VCP0226145 | LEVEL LQ MCM | 1000 | 1736800991 | 1736800991 |
| 3998957 | 7265860 | 2427 | 370428 | 521544 | VCP | 434 | VCP0226144 | LEVEL LQ MCM | 1000 | 1736800991 | 1736800991 |
| 3998958 | 7265860 | 2427 | 370428 | 521544 | VCP | 434 | VCP0226143 | LEVEL LQ MCM | 1000 | 1736800991 | 1736800991 |

